Cambridge Real-Time Bus Locations

For the past month, I have been working on a method for the real-time tracking of the buses within Cambridge.

I used the website MapTiler for the base mapping the Open Bus Data website in order to get the real-time location of buses. I also uploaded a GeoJSON file with the bus stop locations, as these would normally be static and not require frequent updates. I had to create a proxy file in order to access the data due to CORS issues.

Each bus icon represents the real-time location of a bus, with the route number in a colour beneath the icon. Each route number has a different colour allowing users to easily differentiate between the routes. I have also used the lollipop icon in order to show the location of the bus stops.

This method also allows users to search for buses nearest to their location by clicking on the icon below.In the future I will add popups for the bus stops showing their name, and will try to get the colour of the buses to match the colour of the text beneath.

The full website can be found here. As always please let me know your thoughts, and feedback.

London Santander Bike Locations

For the past month, I have been working on a method for the real-time tracking of the availability of London Santander Bikes. 

I used the website MapTiler for the base mapping and hosting of the GeoJSON file with the bike locations. I also used the Transport for London (TfL) API in order to get the real-time number of standard bikes, e-bikes and the number of empty docks.

Each icon represents the location of a docking station, and uses a colour scheme, with red symbolising 0 facilities available, orange symbolising 1 – 4 facilities available and black for 5 or more facilities available. Within the map window, the colour of the icon is selected by the lowest value of standard bikes, e-bikes and empty docks. Clicking on a bike icon shows the name of the docking station, number of standard bikes, e-bikes and empty docks available.

This method also allows users to search for bikes nearest to their location by clicking on the icon below.

The full website can be found here. As always please let me know your thoughts, and feedback.

Is Darth Vader an Effective Leader?

There are several characteristics of an effective leader—some of which Lord Vader demonstrates, and others he completely neglects:

  • Presence – Darth Vader commands a feared and respected presence, both among his enemies and the personnel who serve under him. While this can lead to impressive and quick results, it can also result in a lack of trust among the junior personnel, especially those he Force chokes.

  • Capability – He is a skilled and experienced military commander who wins the majority of his battles. He is also a powerful Force user, demonstrates extensive knowledge in combat and tactics, and is an excellent pilot.

  • Decisiveness – Vader makes decisions quickly and confidently. This is exemplified when he promotes Captain Piett to Admiral immediately after executing his predecessor—an example of ruthless but efficient time management and multitasking.

  • Loyalty – While unwaveringly loyal to the Emperor, Vader shows little loyalty to his subordinates, executing them when they fail him. For example, he force-chokes the Third Sister after she disappoints him by allowing Obi-Wan to go free. He also showed no loyalty to the Jedi Order, executing thousands of them during Order 66.

  • Communication – He communicates effectively, often using terse verbal commands (or a Force choke to underscore a point). However, he rarely consults others before making decisions. He can clarify ambiguous statements when needed, as shown below.

  • Drive – He displays intense motivation in pursuing both his personal goals and the Emperor’s objectives. However he has no drive to pursue anything outside of these goals.

  • Mentorship – Though eager to have his own apprentice, Vader shows no interest in mentoring junior personnel or nurturing talent among his ranks. This is extremely short-sighted as there may be potential Force users within the military of the Empire, who would prove to be potential apprentices.

  • Forgiveness – He hints at a capacity for forgiveness, claiming “The Emperor is not as forgiving as I am” during the construction of the second Death Star. This suggests he recognises forgiveness but exercises it on very rare occasions.

  • Resilience – Vader exhibits remarkable resilience, particularly in adapting to life after severe burn injuries. He retools his fighting style and continues functioning within his life-supporting armour. A notable example of his mental toughness is when, surrounded by enemies, he declares…

  • Emotional Intelligence – While he generally lacks emotional intelligence, he is capable of weaponising others’ emotions. He exploits Luke Skywalker’s concern for Leia to provoke a reaction, attempting to sway him to the Dark Side.

  • Self Awareness– Vader rarely admits fault, but near death, he shows some self awareness and accountability. He asks Luke to tell his sister that “you were right about me,” acknowledging his own redemption in the end.

So while Darth Vader does display some characteristics of being an effective leader, there are several aspects of his leadership style which need a lot of work.

What are your thoughts on Darth Vader’s leadership? Do you think he is a good or poor leader? Are there any other leaders which require an analysis of their management skills?

The Use of AI in the Justice System

During the previous few years, the use of AI has risen exponentially both in the entertainment sphere but also in other mainstream industries and services.

For example, ABBA Voyage has created virtual stars based on real people (known as ABBAtars) in order to present a well-loved show as well as generating large amounts of revenue. While the band members were required for the original motion capture, they did not have to be present at any of the performances in London.

Back in 2020, Robert Kardashian made a speech to commemorate the fortieth birthday of his daughter, Kim Kardashian. Nothing out of the ordinary about that, except for the fact that he had died in 2003, and been resurrected as a holographic animation. He was also very complimentary about his son-in-law, Kanye West, whom he had never met, but who had arranged the reunion through DeepFake holograms.

Now this new technology is having an impact in the legal world. In 2021, Christopher Pelkey was shot dead by Gabriel Paul Horcasitas, while on his way home from a church softball game in Arizona. The perpetrator was later found guilty of manslaughter.

The victim’s sister, Stacey Wales, arranged for the creation of an AI video of Christopher Pelkey, who states that he believes in forgiveness and in a God who forgives. This video was created using real video clips of Christopher during his lifetime, as well as a real photo, which had been taken with an old age filter.

The judge stated that the AI had moved him, and that “his obvious forgiveness of Mr Horcasitas reflects the character I hear about today” and that while the family of the victim had asked for the maximum sentence, the judge noted that “I didn’t hear him ask for the maximum sentence”.

However, the words spoken by the avatar of Pelkey, were not his own. They would have been dictated, written, revised, and agreed by other people, and then fed into the AI model, which would have spoken these words using the image of the deceased victim. While a well educated guess can be made about his future wishes regarding his killer, no one can know for sure what his final statement would have been.

Would the judge have taken into account the avatar’s wishes, if he had requested or demanded the death penalty? Whether this will become more common is hard to guess, but if it does, then it is incumbent on judges passing sentences, to remember that the avatar is not a person, but a well devised personification of certain aspects of their character.

Displaying the ISS on a Map

I have been doing some Continuous Professional Development, and have been working on my JavaScript and API skills.

Using the MapTiler website (mentioned here), I followed the guide to create a real-time location of the ISS Satellite, and have also managed to include a rocket icon to denote the exact location.

To improve this product, I would like to have an automatic zoom feature, instead of fixed zoom, as the ISS is often over water, with no way to tell where in the world it is currently located.

Additionally and ideally, my next project would be to include locations of multiple objects, such as bus locations, and to include useful data such as location, speed, etc, as a pop-up or legend item.

As always, please let me know your thoughts!

Update: Mark Lanwarne, a former colleague of mine, has tweaked the JavaScript code in order to change the zoom settings when the ISS is over a large body of water. This allows a greater understanding of the ISS location in relation to the nearest countries. I have included his version below.

Crime and Poverty as a Predictor of Domestic Violence

Many years ago, as part of my MSc in GIS, I undertook a dissertation exploring the relationship between crime, poverty, and domestic violence.

Domestic violence (DV) has been a growing issue in Northern Ireland, with increasing rates recorded since the centralisation of records in 2005. It is defined as: “Any  incident of controlling, coercive, threatening behaviour, violence or abuse between those aged 16 or over who are, or have been, intimate partners or family members regardless of gender or sexuality.”
 
This study employed Geographic Information Systems (GIS) alongside statistical techniques—specifically, Ordinary Least Squares (OLS) Regression and Geographically Weighted Regression (GWR)—to explore relationships between poverty, various crime types, and domestic violence. The results confirmed the well-established link between poverty and DV, but also revealed significant associations with other crime categories.
 
Unlike most studies, which focus on selected regions, I chose to analyse all of Northern Ireland at the Electoral Ward level. This decision stemmed from the lack of previous country-wide DV research. Northern Ireland, being relatively small in size and population and featuring both rural and urban settings, seemed an ideal case. In hindsight, this scale proved overly ambitious due to the extensive data processing involved. A more focused study on urban centres, such as cities, might have been more manageable.
 
The core aim of the project was to determine whether DV in Northern Ireland is statistically linked to poverty and other crime types. The use of GIS and statistical modelling helped to uncover spatial and temporal patterns, and to identify the most influential socio-economic and crime-related predictors. While DV is underreported globally and locally, prior research has seldom examined it at national scale or in relation to broader crime trends—particularly within the UK. This study helped address that gap.
 
Methodology
 
  • Data Sources: PSNI DV reports (2005–2017), crime statistics, deprivation indices (NIMDM), and census data.
  • Geographic Units: Wards (Ward1993 and Ward2014 formats); areal interpolation was used to convert data between formats.
  • Analytical Tools: ArcGIS (v10.5.1) for spatial analysis, SPSS (v25) for statistical modeling.
  • Statistical Methods:
    • Bivariate correlation (Pearson’s)
    • Ordinary Least Squares (OLS) regression
    • Geographically Weighted Regression (GWR)

Key Findings

Strongest DV predictors:
 
  • Criminal damage, violence/sex/robbery, and social housing were consistently strong predictors.
  • Low vehicle ownership showed a high correlation with DV.
  • Temporal patterns: DV rates have risen steadily since 2009, with 397 of 462 wards reporting increases.
  • Spatial patterns: Higher DV rates were clustered in urban areas such as Belfast and Derry-Londonderry.
  • Model performance:
    • OLS models showed high adjusted R² values, indicating strong predictive capability.
    • GWR provided better local model fit but was sensitive to data quality and geographic unit issues.
  • Data issues: Converting between old and new ward boundaries introduced potential inaccuracies due to the Modifiable Areal Unit Problem (MAUP).
Limitations
 
  • DV data limited to annual reports with no detailed time, demographic, or geographic breakdown.
  • Underreporting of DV likely.
  • Conversion between spatial datasets may have introduced errors.
  • Lack of individual-level data limited granularity.
Conclusions
 
There is a significant correlation between DV, poverty, and other crime types.
Socio-economic indicators (like lack of education, vehicle ownership, and social housing) are strong predictors. This research supports more targeted resource allocation to reduce DV in high-risk areas.

Personal Development

During the past week, I have been working on using MapTiler, and looking at the work of Ben James, who I spoke about a few weeks ago here. I have been trying to create an interactive map showing location of eBike base locations.

I have managed to create a base map of London using HTML and JavaScript using the following guide. I then converted a file containing X,Y co-ordinates of all eBike base locations into a GeoJSON. I then uploaded this into MapTiler and used it to create the below map.

I used the TfL API found here, in order to get the base locations, as well as the number of bikes currently stored at each location. However in order to be useful, it would be necessary for each location to be updated  regarding its number of available bikes on a minute by minute basis. While I have been mostly successful in obtaining this data using Python, I will need to convert my code into JavaScript, so it can be successful integrated within HTML code.

I plan to use a color-coding symbology to show whether there are no bikes available, and the quantity of original bikes and eBikes. Wish me luck!

From Field to Dashboard: A Real-World End-to-End GIS Workflow

Today, I’ll provide a brief overview of a practical process that transforms original, non-geographic data into an interactive GIS dashboard.

End User Requirements

While it may be tempting to jump straight into the technical side, it’s crucial to start by understanding the end user’s requirements. This often involves clear communication to grasp their overall goals and to understand the question which needs to be answered. You may be working with multiple stakeholders, both internal and external, which can require a large amount of negotiation around user requirements and enforced constraints.

Will it be a one off product, or will it need to be updated on a regular basis? Some data will be regularly updated on a pre-defined schedule, while other data may be updated at irregular intervals. Census data is updated every ten years, while some medical datasets are updated on a monthly or bi-weekly basis.

Source Data Acquisition

The next step is identifying the source data— especially regarding its location and format. Is it available via an API or stored in Excel spreadsheets? Was it submitted through online forms, allowing for some automation? Or, less ideally, was it saved as JPEGs or XPS files, or even handwritten notes tucked away in a filing cabinet like a relic from the Stone Age?

Source Data Limitations

Data is often restricted for a variety of reasons. For example, patient or crime location data must be anonymised before public release. If you’re lucky, the dataset is already open source and free of restrictions.

In some cases, national security classifications (e.g., USUK access controls) may prevent data sharing. Even unclassified data may be restricted if its method of collection is sensitive.

Data Processing

Unless you’re extraordinarily fortunate, the raw data will need cleaning and transformation.

You might begin with Excel to identify necessary changes and to see the data at all times, and the effects of your data manipulation. Tools like PowerBI or ArcGIS Toolbox offer accessible and visual methods for data processing. I’ve also used Python extensively for its versatility and ability to automate complex workflows.

There may be some limitations, which can be worked around, or other limitations, which can be shop-stoppers. For example, downloading a dataset as an Excel spreadsheet may not be able to be automated, according to which solution you choose. This would result in a step in the process, where you have to manually click a button in order to upload a file for processing.

Data Presentation

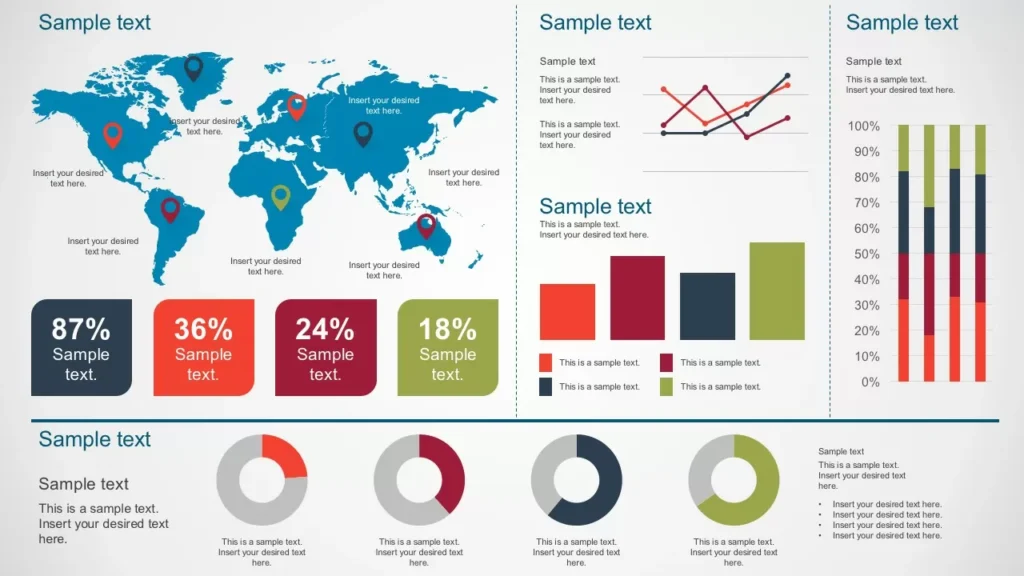
ArcGIS Online (AGOL) provides multiple options for presenting your data—interactive dashboards, web apps, and Experience Builder templates among them.

Designing a dashboard that balances user needs and organisational design standards can be tricky. Effective use of symbols and color schemes helps make outputs accessible to non-experts. I’ve also created guides to improve the user experience and added disclaimers to clarify data limitations.

Another key factor is device compatibility. A dashboard optimised for widescreen monitors might need redesigning for mobile devices. Layout, symbology sizing, and legend placement should all be tested and refined.

Continuous User Engagement

Engagement with end users should continue throughout the development process. Avoid the temptation of a strict waterfall approach, which can restrict communication with the end user. Instead, aim to deliver a minimum viable product and iteratively improve it. This leads to better feedback, smoother development, and a more satisfying user experience.

Are Leaders Born or Made?

This is a vital question, especially for those with a military background. It has been stated that approximately 10% of the population are natural leaders, while an additional 20% have the potential to become leaders with the right training and experience.

The Royal Military Academy Sandhurst (RMAS) is responsible for transforming civilians into military leaders over a 44-week course. In contrast, Other Ranks (OR) personnel are required to attend shorter, one-month leadership courses as a prerequisite for promotion to the next rank.

Leadership is taught on these courses through a variety of methods, including classroom-based lessons, infantry exercises, and a number of command tasks—such as section attacks or patrolling in full CBRN kit. Indeed, if you’re lucky like I was, you might even get to combine the two. And, as a reward for doing it well, you may be asked to demonstrate it again for the rest of the course!

It can be difficult to appreciate the finer points of leadership when on exercise in Dartmoor, running on little sleep, and trying to stave off hypothermia.

However, this is a key aspect of developing leadership skills — learning to lead effectively in adverse environments and under less-than-ideal circumstances. Demonstrating leadership is a core requirement for promotion within the military. With promotion comes increased pay, further leadership qualifications, more opportunities for advancement, and a larger pension.

So, returning to the original question—are leaders born or made? Some individuals are born with natural leadership qualities, but they are very much in the minority. Even they benefit from training and experience. The rest must undergo training and refine those lessons through practice to gain leadership experience.

Live London Underground Map

This week I will be talking about a 3D map, created by Ben James, which displays the real-time location of underground trains.

This map is fully interactive with users being able to navigate around the landscape, and select lines and trains in order to find out more information about them.

Live Tube Map

The author, Ben James, has his own website with his thoughts on engineering and writing here https://www.benjames.io/ He has also added a portfolio of past projects, including an electric Gru-mobile from Despicable Me and various audio plugins.

He has also added his data sources available from the TfL API here, as well as station depths and tube lines.

As a final note, Ben has added a warning regarding the TfL data “You will regret using this data. You will regret using this API.”

While I have used some TfL datasets in the past to create Tube routes and bus route mapping and accessibility to North London hospitals, I have not been able to create anything such like this….yet! But I do enjoy a challenge!